TheScientificTriangle
What about the environment and science
Water Sustainability Initiatives- An Insight [2024]

Learn how sustainability initiatives can create harmony and bring back the balance we almost lost. What are sustainability initiatives, and why can they offer such immense help to us? Learn more from here.
Sustainability initiatives towards climate change would include saving the most essential resources for the future. Water, air, food, and sunlight maintain life and are some of the pillars to look at.
All in all, water is difficult to create, clean, or manage. Without clean water, surviving or thriving is truly not possible (it cannot be called impossible, which stands for I-m-possible).
Cleaning the air is easier than cleaning the water. Growing food in controlled conditions and keeping it clean is also possible. But cleaning and maintaining water is hard, very difficult.
If cleaning water bears a cost, creating more and more fresh water is also pricey; maintaining fresh water is the only way in that case. The only way to spend less on water is by keeping it in a fresh state. Sustainability initiatives around water conservation are thus not necessary; in fact, they are the only way to save lives and the planet.
To make sense of what can be done, we will go through the most essential points.
- How water was treasured and sustained across cultures.
- Sustainability initiatives to clean the water sources.
- Reasons why there is an increase in clean water stress around the world.
How water is treasured and sustained across cultures– story of sustainability initiatives in the starting
Apart from what we know of Ganga’s descent on Earth, Bhagirath, an Ikshvaku king, brought her down for several reasons. When King Sagar was conducting an Ashvamedh Yagya, Lord Indra, fearful of King Sagar, stole the horse and tied it at Kapil Muni’s ashram. The Ikshvaku King, King Sagar, sent all his sixty thousand sons and Asmanja, his other son, to search for the horse. When they found the horse tied in Kapil Muni’s ashram, they thought he stole the horse, and when they tried attacking him, he cursed them to death. One of the descendants of King Sagar came back to Kapil Muni to ask him how their souls could be quenched, and Kapil Muni suggested it could only be done by the water of the Ganges. Bhagirath, a descendant of King Sagar, could finally seek the permission of Lord Brahma to carry Ganges with him to Earth.
This story is the Kali Yuga version and is a symbolic representation of the real story.
1. A black horse symbolizes uncertainty and fear.
An Ashvamedh Yagna, where a horse is sacrificed, is done to gain power, dominance, or blessings. It is a ritual from the Black Yajur Veda that is banned from being practiced in Kali Yuga.
2. Kapil Muni represents knowledge, a man capable of lifting the veil from the doors of fear.
3. The disappearance of the sons when cursed by Kapil Muni shows an event.
4. Lord Indra represents the anger and the miscalculations wherein even Lord Indra could not get it right.
5. Moksha of the sons is through their service to us which is the mankind.
The reality of the story, which seems more like a fable, is known across the country.
In this story, it is told that King Sagar, with his sixty thousand sons, was assigned a mission to find water for the newly created Earth.
Kapil Muni was the scientist presiding over the project.
The king was investing his wealth and labor in creating water.
But after years of experimentation, even though they created huge volumes of water successfully, but a small error by these sixty thousand workers made the water undrinkable. Many stories revolve around how the seawater turned salty. You could choose to believe anything that suits your intellect.
Despite Kapil Muni’s expert instructions, they could not achieve success. A small mistake in their carrying out the experimentation turned the tide. The black horse is nothing but the fear in the hearts of these sixty thousand sons of King Sagar. On judgment day, it was decided that their deaths alone could restore balance to the huge problem that had been created. These sixty thousand sons of King Sagar were sacrificed, and it is often believed that they are the fish we keep eating. The souls still repeat in these fish, and how the soul system is distributed in the fish is different from how it is distributed in men. Sixty thousand souls are nothing but the sixty thousand clans of King Sagar whom we keep consuming, all thanks to the curse of Kapil Muni. Their path of liberation was paved through the human stomach.
Earth still stood without proper sources of drinking water in the northern parts, King Sagar sent one of his descendants to Kapil Muni for a solution, who was still experimenting. Even though he did not spare the lives of these 60000 sons, he did understand that others were in dire need of water. So, he finally gave them the solution. By then he had merged the experiments of his own with that of Lady Ganga. She was a disciple in Brahma Dev’s school. It was almost difficult to empty Earth of the oceans which were given to King Sagar (who wanted to stay back on Earth for his fallen sons to support lives here as it was his sons who got it wrong. He sent back his other sons and asked them to return to their kingdom while he stayed with his fallen sons back) by Kapil Muni for the lives of his sons. There was still another way and that was to bring water into the inlands of the landscapes. Kapil Muni took his experiments to Lady Ganga who was also experimenting on finding better water solutions for her haven. She learned from the greatest and finally could derive fresh, clean water for the haven. They both merged their findings and observations and invented the water of the Ganges. The water of Ganges that comes down to Earth is clean and has a microbial composition that does not allow the water to expire. It means people could store huge amounts of Ganges water in their homes to fulfill their needs. The ashrams located on the Ganges would store water for up to three months to pave the way through the harsh winter months and the monsoons when the ashrams were moved further inside to prevent flooding.
The roots of the Ganges were kept close to the haven and she was also supposed to play the role of a mirror of men’s souls on Earth.
Finally, Bhagirath was granted the project to pave the way for Ganges to descend. Ganga decided to create a small tributary of her water sending it down to Earth.
In all this, Lord Shiva comes into the picture, as he symbolizes the Himalayas and is still often found wandering there. The clan of Shiva does not leave the Himalayan territory ever and that is as far they come upon Earth.
Only the tough rocky terrain of Lord Shiva’s lands could hold her weight when she fell down from the Gaumukh glacier. It was a huge task for King Bhagirath, as it was not easy to carve such a way. There were several animal species that came forward and helped the mission. These animals were raised as beings before Kali Yuga, and when man took center stage, did they get transformed into creatures at the mercy of humans? But who knows if it is a test for this human clan and what lies ahead?
The story is old and from a time when humans lived differently. But it shows how water was brought to Earth. The sage from whom we learned the story said that if anybody could know the real story underlining Ganga’s descent, they would never dare dirty it, and neither would dirty their souls. Ideally, a mirror reflects all that we have become to someone who is interested in knowing—the Gods!
- Using pitchers
- Training people in ways they can use less water
- Knowing ways and using alternatives for water.
- Storing rainwater
- Developing fabrics that require less water for cleaning
- Using water capsules to quench thirst during long journeys reduces the water needs of the body.
Some of the earliest known ways in which water conservation and sustainability initiatives existed in our country.
Sustainability initiatives to clean the water sources
Thousands of such initiatives are underway, and governments are often trying to make them better for people. Sustainability initiatives taken across the world to clean up the waters include:
- Sustainability initiatives towards creating clean water sources would include stopping the use of water for as many activities as possible. If car cleaning, bike cleaning, floor cleaning, making waterless toilets, and washing clothes could be done without water, imagine the amount of water that could be saved!
- Creating effective dams, yet not too many as part of schemes for sustainability initiatives, could solve the problem of water for many while keeping the environment together.
- Using solar-powered desalination techniques could also be a decent way for countries that lack underground clean water sources- as part of sustainability initiatives.
- Sustainability initiatives would mean utilizing different water reuse technologies that could be another way of dealing with the problem. Reclaimed water could save people and resources equally. Using water in the right way would mean channeling the water towards creating the right kind of water opportunities. Filling water gaps could even be possible, and globalizing the water needs could also help or serve as a step towards creating sustainability initiatives towards feeding water to all.
Which industries consume more water and how can they utilize other water sources could be a major player in creating better platforms for sustainability initiatives.
| Consumption industries | Amount consumed (%) | Water recycling source: Suggestive for sustainability initiatives |
| Agriculture | 70 | Recycling washbasin water from institutions, companies, and organizations with minor filtration measures to clean soaps and other milder effluents |
| Industrial uses | 20 | If a certain industry does not have any water specifications, like the water used for cooling iron and other such tasks, it could use recycled sewage water. |
| Domestic uses | 4 | Could use freshwater and recycled water normally available after several layers of filtration |
| Upkeeping lawns, gardens, and golf courses | 3 | Simple, recycled water |
| Cleaning purposes | 3 | Recycled water |
5. Running sustainability initiatives like the ones below is being done globally.
- Jal Shakti Abhiyan, India
- AMRUT 2.0
- Pradhan Mantri Krishi Sinchayee Yojna (PMKSY)
- The Bureau of Water Use Efficiency (BWUE)
- National Water Mission
- Huaifang Underground Water Reclamation Plant (HWRP)
- Omdurman Water Supply Optimisation Scheme, Sudan
- Water sustainability initiatives in Andean communities
6. In one of the latest tweets, Anand Mahindra, the industry giant, shared a video where a man tags a pipe to the AC and puts a tap at the other end of it. Withdrawing the water collected in the pipe, the man is shown to be using it for several other purposes, like mopping the floor, gardening, and flushing the toilet. The idea might need more refining, but it is such ideas from normal people that can help people move towards a greener version of themselves. Such sustainability initiatives might be worthier when assessed and used appropriately.
7. Raising awareness about water usage, deficits and teaching people about saving water.
8. Decreasing the rift between rich and poor when it comes to water distribution.
9. Levying taxes on wasting water for organizations- one of the stricter sustainability initiatives.
10. Keeping a committee that can overlook the amount of water usage in every large-scale industry and organization. Also, one that can provide tips for better water management even at home.
11. Cleaning any water body to be achieved with minimal labor and cost- designing proper sustainability initiatives.
12. Using technology to clean our rivers instead of manpower and investing in the development of this intelligent equipment.
13. Encouraging and using appropriate water laws whereby borewell creation should be rigorously monitored to prevent sewage leakage into the drinking water. Finding suitable ways to create a single resource point for many to withdraw water from instead of allowing individual borewells in flats.
As part of suggestive sustainability initiatives: If there are six five-story flats within a compound, they should have one or two borewells instead of having six separate borewells feeding six different flats. Creating deeper borewells could solve the problem. Calculating the water needs of the inmates before creating flats could help in calculating the number of borewell requirements better.
14. Giving every city and town, a recycled water plant that can be used for nonessential purposes like watering plants and cleaning purposes- far fetched sustainability initiatives to think about.
15. Interlinking rivers could be the ultimate (part of sustainability initiatives) solution, as was proposed by our current Prime Minister, Narendra Modi. There are a few side effects of merging rivers, but if the Indian Peninsula could have a connected water supply, it could solve the water problem in many regions of the country. However, with due checks in place from the government, it could cure the everlasting water crisis in our country. It would also mean stopping the drainage of industrial sludge and effluents into rivers. Industrial sludge and effluents in one river could pollute the entire country in this case.
16. Sustainability initiatives for managing industrial effluents. Building underground sealed compartments for hot and cold industrial sludge by utilizing the empty spaces in industries and then refiltering the sludge or using it for construction, road making, or other such purposes could also relieve the rivers (chosen ways of managing the industrial effluents would need careful consideration of the elements in the sludge). Even the construction of sealed environments would need to be done separately for separate kinds of industries. Finding better ways of waste management could make a lot of difference to our rivers.
For example, Yamuna is laden with nickel, lead, chromium, copper, zinc, and cadmium.
Suggestive: sustainability initiatives: Finding a suitable filtration technique could help save the river. Which filtration technique could work on an entire river and needs to be thoroughly investigated? Using artificially made coral rubbles or reef structures by placing them in a mesh structure and seizing both ends with either pillars or structures outside the river could serve as a way of cleaning Yamuna. Replacing the rubble or the mesh every 3 months could actually help clean the Yamuna.
Suggestive: sustainability initiatives: Allowing the growth of barnacles, tunicates, and other filtering organisms could still save the waters.
Sustainability initiatives: Metakaolin clay, hydrated gel, and certain other filtering substances with a structural architecture that could handle the river water velocity and yet continue the filtration process could be achieved. Also, using these structures in areas with the least water velocity or in places where they could grow can save our Ganges and Yamuna, along with other essential rivers.
Top 10 Reasons for inefficient water sustainability initiatives
What makes water so precious on this planet is its limited availability. With the increase in demand, there is also a lot of water waste. Improper rerouting of water and using freshwater for purposes other than drinking are some of the major concerns coming up late when thinking of developing sustainability initiatives around it.
Here are the top 10 reasons for increased water stress across the globe leading to the hindrance of inefficient water sustainability initiatives.
1. Increase in population
Sustainability initiatives aimed at keeping the population in balance are a myth.
Refer to the increase in population for this representation and depiction. Also refer to the increased freshwater consumption over the years. You will notice a relative relationship between these two metrics under close observation.
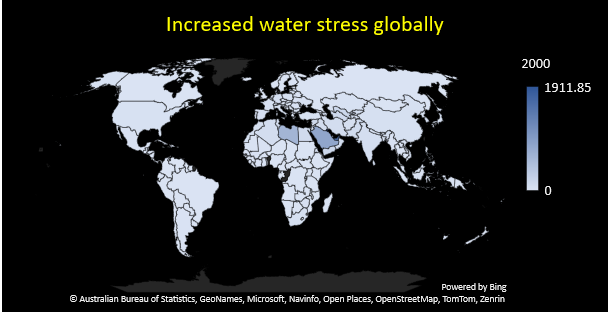
If you go through the data below carefully, you will realize that there is a trend observed in increased water stress across different nations

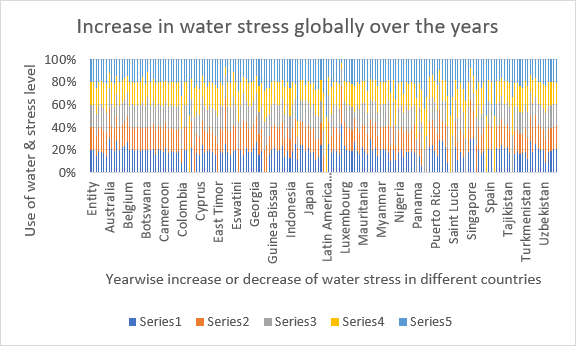
| Entity (%) | 2000 | 2005 | 2010 | 2015 | 2020 |
| Afghanistan | 54.76 | 54.76 | 54.76 | 54.76 | 54.76 |
| Algeria | 79.26 | 92.49 | 104.92 | 125.99 | 137.92 |
| Angola | 1.7 | 1.87 | 1.87 | 1.87 | 1.87 |
| Antigua and Barbuda | 7.63 | 9.81 | 8.85 | 8.46 | 8.46 |
| Argentina | 8.42 | 9.35 | 10.27 | 10.46 | 10.46 |
| Armenia | 37.74 | 55.9 | 42.89 | 66.01 | 57.09 |
| Australia | 8.71 | 7.53 | 5.3 | 3.71 | 3.47 |
| Austria | 10.05 | 9.79 | 9.64 | 9.64 | 9.64 |
| Azerbaijan | 48.53 | 52.11 | 48.44 | 51.62 | 55.6 |
| Bahrain | 248.91 | 196.43 | 173.08 | 137.16 | 133.71 |
| Bangladesh | 5.72 | 5.72 | 5.72 | 5.72 | 5.72 |
| Barbados | 101.25 | 87.5 | 87.5 | 87.5 | 87.5 |
| Belarus | 6.05 | 5.62 | 5.1 | 4.77 | 4.38 |
| Belgium | 92.54 | 78.45 | 73.13 | 49.07 | 51.58 |
| Belize | 1.26 | 1.26 | 1.26 | 1.26 | 1.26 |
| Belize | 1 | 0.98 | 0.98 | 0.98 | 0.98 |
| Bermuda | 3.92 | 3.92 | 4.24 | 4.24 | 4.24 |
| Bhutan | 1.41 | 1.41 | 1.41 | 1.41 | 1.41 |
| Bolivia | 1.11 | 1.15 | 1.18 | 1.18 | 1.18 |
| Bosnia and Herzegovina | 2.47 | 2.51 | 2.89 | 2.78 | 2 |
| Botswana | 2.03 | 2.04 | 2.06 | 1.96 | 2.31 |
| Brazil | 2.65 | 2.73 | 3.54 | 3.02 | 1.48 |
| Brunei | 3.47 | 3.47 | 3.47 | 3.47 | 3.47 |
| Bulgaria | 45.33 | 46.98 | 44.05 | 41.61 | 37.52 |
| Burkina Faso | 6.2 | 7.82 | 7.82 | 7.82 | 7.82 |
| Burundi | 10.48 | 10.19 | 10.19 | 10.19 | 10.19 |
| Cambodia | 1.04 | 1.04 | 1.04 | 1.04 | 1.04 |
| Cameroon | 1.39 | 1.56 | 1.56 | 1.56 | 1.56 |
| Canada | 4.31 | 4.27 | 3.83 | 3.68 | 3.73 |
| Cape Verde | 7.18 | 8.43 | 8.43 | 8.43 | 8.43 |
| Central African Republic | 0.31 | 0.34 | 0.34 | 0.34 | 0.34 |
| Chad | 3.81 | 4.29 | 4.29 | 4.29 | 4.29 |
| Chile | 7.35 | 8.71 | 8.98 | 8.98 | 8.98 |
| China | 40.23 | 40.47 | 42.86 | 43.22 | 41.52 |
| Colombia | 1.16 | 1.54 | 2.37 | 3.89 | 4.36 |
| Comoros | 0.83 | 0.83 | 0.83 | 0.83 | 0.83 |
| Congo | 0.03 | 0.03 | 0.03 | 0.03 | 0.03 |
| Costa Rica | 0 | 0 | 0 | 5.45 | 5.35 |
| Cote d’Ivoire | 6.17 | 6.78 | 5.84 | 5.09 | 5.09 |
| Croatia | 0 | 1.37 | 1.5 | 1.52 | 1.48 |
| Cuba | 18.02 | 18.1 | 20.71 | 23.94 | 23.94 |
| Cyprus | 22.01 | 22.79 | 27.46 | 31.71 | 37.59 |
| Czechia | 32.57 | 29.58 | 29.67 | 24.33 | 20.77 |
| Democratic Republic of Congo | 0.19 | 0.23 | 0.23 | 0.23 | 0.23 |
| Denmark | 20.53 | 17.01 | 21.87 | 21.95 | 26.4 |
| Djibouti | 6.33 | 6.33 | 6.33 | 6.33 | 6.33 |
| Dominica | 8.3 | 8.58 | 10 | 10 | 10 |
| Dominican Republic | 26.96 | 30.21 | 39.55 | 39.55 | 39.55 |
| East Timor | 0 | 28.27 | 28.27 | 28.27 | 28.27 |
| Ecuador | 6.41 | 6.78 | 6.78 | 6.78 | 6.78 |
| Egypt | 103.88 | 119.15 | 134.43 | 110.93 | 141.17 |
| El Salvador | 8.58 | 13.21 | 7.16 | 2.36 | 2.43 |
| Equatorial Guinea | 0.16 | 0.18 | 0.18 | 0.18 | 0.18 |
| Eritrea | 7.94 | 11.18 | 11.18 | 11.18 | 11.18 |
| Estonia | 15.13 | 18.03 | 19.94 | 17.48 | 9.23 |
| Eswatini | 75.67 | 77.56 | 77.56 | 77.56 | 77.56 |
| Ethiopia | 0 | 24.04 | 27.78 | 31.51 | 32.26 |
| Fiji | 0.29 | 0.3 | 0.3 | 0.3 | 0.3 |
| Finland | 6.96 | 14.13 | 11.52 | 6.46 | 7.11 |
| France | 28.63 | 29.28 | 25.02 | 24.61 | 23 |
| Gabon | 0.43 | 0.5 | 0.5 | 0.5 | 0.5 |
| Gambia | 1.97 | 2.21 | 2.21 | 2.21 | 2.21 |
| Georgia | 6.24 | 5.91 | 5.75 | 5.27 | 5.39 |
| Germany | 61.52 | 51.78 | 45.22 | 33.91 | 33.5 |
| Ghana | 4.28 | 4.87 | 5.46 | 6.27 | 6.31 |
| Greece | 18.24 | 19.51 | 19.94 | 20.04 | 20.48 |
| Grenada | 0 | 5 | 6.14 | 7.05 | 7.05 |
| Guatemala | 0 | 5.43 | 5.74 | 5.74 | 5.74 |
| Guinea | 0.89 | 0.88 | 1.07 | 1.26 | 1.37 |
| Guinea-Bissau | 1.5 | 1.5 | 1.5 | 1.5 | 1.5 |
| Guyana | 3.74 | 3.57 | 3.3 | 3.3 | 3.3 |
| Haiti | 12.4 | 12.95 | 13.38 | 13.38 | 13.38 |
| Honduras | 4.62 | 4.62 | 4.62 | 4.62 | 4.62 |
| Hungary | 10.09 | 9.66 | 9.27 | 6.96 | 8.07 |
| Iceland | 0.22 | 0.25 | 0.36 | 0.38 | 0.39 |
| India | 62.68 | 64.59 | 66.49 | 66.49 | 66.49 |
| Indonesia | 15.11 | 19.67 | 24.23 | 28.78 | 29.7 |
| Iran | 77.39 | 81.29 | 81.29 | 81.29 | 81.29 |
| Iraq | 92.69 | 79.64 | 66.6 | 49.02 | 79.51 |
| Ireland | 4.67 | 3.85 | 4 | 5.79 | 21.64 |
| Israel | 139.19 | 121.29 | 115.61 | 98.87 | 110.09 |
| Italy | 39.7 | 32.32 | 29.7 | 29.92 | 29.81 |
| Jamaica | 10.49 | 11.86 | 13.23 | 7.67 | 12.47 |
| Japan | 41.56 | 38.36 | 37.24 | 36.74 | 36.05 |
| Jordan | 82.57 | 95.94 | 98.9 | 96.16 | 104.31 |
| Kazakhstan | 29.13 | 34.4 | 33.02 | 30.04 | 34.1 |
| Kenya | 12.86 | 21.24 | 26.53 | 26.55 | 33.24 |
| Kuwait | 1911.85 | 2380.54 | 2889.77 | 3399 | 3850.5 |
| Kyrgyzstan | 65.45 | 52.61 | 50.04 | 50.04 | 50.04 |
| Laos | 0 | 2.28 | 3.75 | 5.12 | 4.79 |
| Latin America and the Caribbean (UN) | 0 | 0 | 0 | 5.75 | 5.98 |
| Latvia | 1.71 | 1.31 | 1.62 | 1.04 | 1.07 |
| Lebanon | 41.08 | 35.56 | 47.18 | 58.79 | 58.79 |
| Lesotho | 2.57 | 2.57 | 2.57 | 2.57 | 2.57 |
| Liberia | 0.24 | 0.26 | 0.26 | 0.26 | 0.26 |
| Libya | 615.43 | 698.07 | 783.12 | 817.14 | 817.14 |
| Lithuania | 21.85 | 17.02 | 7.47 | 2.75 | 1.83 |
| Luxembourg | 4.93 | 4.35 | 3.95 | 3.71 | 3.96 |
| Madagascar | 11.19 | 11.26 | 11.26 | 11.26 | 11.26 |
| Malawi | 15.95 | 17.5 | 17.5 | 17.5 | 17.5 |
| Malaysia | 2.89 | 2.99 | 3.09 | 3.19 | 3.44 |
| Maldives | 17.67 | 14.48 | 3.38 | 15.67 | 15.67 |
| Mali | 7.45 | 7.97 | 8 | 8 | 8 |
| Malta | 61.27 | 70.65 | 80.99 | 82.77 | 81.86 |
| Mauritania | 15.71 | 13.25 | 13.25 | 13.25 | 13.25 |
| Mauritius | 22.17 | 25.12 | 23.16 | 22.25 | 22.06 |
| Mexico | 25.57 | 28.58 | 29.87 | 32.13 | 44.82 |
| Moldova | 20.66 | 12.65 | 12.64 | 12.47 | 12.56 |
| Mongolia | 3.59 | 3.75 | 3.9 | 3.15 | 3.4 |
| Morocco | 60.48 | 63.47 | 50.75 | 50.75 | 50.75 |
| Mozambique | 1.04 | 1.3 | 1.52 | 1.75 | 1.75 |
| Myanmar | 5.8 | 5.8 | 5.8 | 5.8 | 5.8 |
| Namibia | 0.9 | 0.86 | 0.86 | 0.86 | 0.86 |
| Nepal | 8.37 | 8.31 | 8.31 | 8.31 | 8.31 |
| Netherlands | 16.01 | 21.93 | 20.75 | 15.97 | 16.8 |
| New Zealand | 2.76 | 3.79 | 4.24 | 8.05 | 8.05 |
| Nicaragua | 2.42 | 2.63 | 2.64 | 2.42 | 2.22 |
| Niger | 3.59 | 4.2 | 5.45 | 7.34 | 11.02 |
| Nigeria | 7.99 | 8.97 | 9.67 | 9.67 | 9.67 |
| North Korea | 27.41 | 27.74 | 27.74 | 27.74 | 27.74 |
| North Macedonia | 16.75 | 28 | 22 | 20.83 | 38.7 |
| Norway | 1.83 | 2.08 | 2.13 | 2.06 | 2.05 |
| Oman | 92.86 | 91.11 | 107.11 | 116.71 | 116.71 |
| Pakistan | 105.86 | 109.77 | 113.66 | 120.79 | 116.31 |
| Palestine | 40.08 | 58.19 | 38.63 | 41.53 | 50.26 |
| Panama | 0 | 0 | 0.77 | 0.93 | 0.9 |
| Papua New Guinea | 0.09 | 0.13 | 0.13 | 0.13 | 0.13 |
| Paraguay | 0.37 | 1.01 | 1.62 | 1.84 | 1.84 |
| Peru | 0 | 0 | 3.41 | 5.63 | 7.18 |
| Philippines | 0 | 0 | 25.46 | 26.41 | 26.25 |
| Poland | 42.05 | 41.18 | 37.63 | 36.16 | 30 |
| Portugal | 21.43 | 19.08 | 17.97 | 17.3 | 12.32 |
| Puerto Rico | 19.12 | 22.29 | 22.71 | 19.54 | 19.54 |
| Qatar | 282.59 | 374.14 | 409.91 | 431.03 | 431.03 |
| Reunion | 13.69 | 12.34 | 11.79 | 5.3 | 4.3 |
| Romania | 9.03 | 5.72 | 5.82 | 6.05 | 6.01 |
| Russia | 4.83 | 4.41 | 4.43 | 3.97 | 4.12 |
| Rwanda | 4.97 | 8.34 | 12.46 | 16.57 | 20.2 |
| Saint Kitts and Nevis | 0 | 0 | 0 | 50.83 | 50.83 |
| Saint Lucia | 0 | 0 | 14.3 | 14.3 | 14.3 |
| Saint Vincent and the Grenadines | 9.75 | 9.5 | 8.5 | 7.9 | 7.9 |
| Sao Tome and Principe | 0.79 | 1.13 | 1.47 | 1.81 | 1.88 |
| Saudi Arabia | 819.76 | 894.82 | 914.51 | 948.88 | 974.17 |
| Senegal | 8.45 | 12.08 | 12.53 | 12.99 | 16.28 |
| Serbia | 0 | 0 | 4.98 | 5.28 | 6 |
| Sierra Leone | 0.44 | 0.5 | 0.5 | 0.5 | 0.5 |
| Singapore | 313.89 | 377.52 | 219.91 | 84.58 | 83.12 |
| Slovakia | 5.04 | 3.9 | 2.58 | 2.47 | 2.39 |
| Slovenia | 0 | 6.24 | 6.26 | 6.06 | 6.78 |
| Somalia | 24.47 | 24.53 | 24.53 | 24.53 | 24.53 |
| South Africa | 40.77 | 44.18 | 47.59 | 59.75 | 65.03 |
| South Korea | 80.78 | 85.22 | 85.22 | 85.22 | 85.22 |
| South Sudan | 0 | 0 | 0 | 4.23 | 4.23 |
| Spain | 49.22 | 51.04 | 47.73 | 42.96 | 43.25 |
| Sri Lanka | 91.24 | 90.79 | 90.79 | 90.79 | 90.79 |
| Sudan | 0 | 0 | 0 | 118.66 | 118.66 |
| Suriname | 4.3 | 4.01 | 3.95 | 3.95 | 3.95 |
| Sweden | 3.88 | 3.8 | 3.88 | 3.43 | 3.58 |
| Switzerland | 9.66 | 9.02 | 8.04 | 6.51 | 6.5 |
| Syria | 134.22 | 125.96 | 125.16 | 124.36 | 124.36 |
| Tajikistan | 81.2 | 75.08 | 71.58 | 68.74 | 69.94 |
| Tanzania | 10.65 | 12.96 | 12.96 | 12.96 | 12.96 |
| Thailand | 0 | 0 | 23.01 | 23.01 | 23.01 |
| Togo | 2.58 | 3.39 | 3.39 | 3.39 | 3.39 |
| Trinidad and Tobago | 18.98 | 18.68 | 20.05 | 20.33 | 20.33 |
| Tunisia | 66.02 | 72.85 | 79.12 | 92.02 | 98.11 |
| Turkey | 31.2 | 29.9 | 34.88 | 39.89 | 45.71 |
| Turkmenistan | 127.91 | 143.56 | 144.08 | 144.73 | 135.21 |
| Uganda | 3.02 | 4.57 | 5.83 | 5.83 | 5.83 |
| Ukraine | 23.68 | 19.54 | 19.24 | 11.8 | 12.26 |
| United Arab Emirates | 1555.87 | 1866.67 | 1781.52 | 1696.36 | 1587.33 |
| United Kingdom | 21.29 | 21.96 | 14.09 | 13.91 | 14.35 |
| United States | 30.01 | 30.33 | 26.53 | 28.16 | 28.16 |
| Uruguay | 9.79 | 9.79 | 9.79 | 9.79 | 9.79 |
| Uzbekistan | 153.08 | 140.98 | 143.05 | 158.13 | 168.92 |
| Venezuela | 3.02 | 6.01 | 7.54 | 7.54 | 7.54 |
| Vietnam | 15.9 | 18.13 | 18.13 | 18.13 | 18.13 |
| Yemen | 161.14 | 169.76 | 169.76 | 169.76 | 169.76 |
| Zambia | 2.9 | 2.84 | 2.84 | 2.84 | 2.84 |
| Zimbabwe | 35.74 | 35.9 | 32.9 | 31.87 | 35.41 |
Upon careful observation, the findings can be extrapolated to fit under these findings. If sustainability initiatives are to start, these observations could serve as a base.
- In some countries like Iraq, the United Arab Emirates, Uzbekistan, Turkmenistan, Saudi Arabia, and Qatar, the water stress increase is quite prominently observed. It is clearly related to the increased population and the increase in migrant workers and immigrants, oil wells and global warming: sustainability initiatives need to be formed differently.
- Oceanic nations, small European countries and certain African developing nations have shown no significant increase in water stress over the years. The population might have been regulated by certain essential factors like their climatic conditions, dwindling resources, migrating population, and their cultural controls in place towards the use of water.
- Developed nations show a far higher water stress level, which has increased over the years, and yet the rise in stress levels is quite steady allowing governments to run better sustainability initiatives.
- No country shows an erratic rise or fall in freshwater demands over the years. It means sustainability initiatives can be developed and can also be followed for a certain period.
- Most countries show an increased water stress level, and only a few show a decline in water stress levels.
How is water use related to an increased carbon footprint, and what needs to be understood for taking sustainability initiatives includes:
- Increased use of fossil fuels.
- Increased use of electricity to transport water across channels.
- Production of water contributes to an increase in carbon footprint.
- Damage or destruction of critical water-dependent carbon sinks—peatlands—is increasing the carbon footprint significantly.
The average distribution of peatlands is found in every climatic condition: sustainability initiatives should focus on restoring these.
Here is a map to refer to the major peatland areas (reference: peatlang.org) spread across the globe.
.

According to the UN Environment Program, Earth is losing 500000 hectares of peatlands every year. It is synonymous with 5% of annual human induced global carbon emissions.
As per forestnews.cifor.org, the loss of peatlands at this rate could contribute to 2800 years’ worth of carbon footprint. Sustainability initiatives would mean retrieving or making all efforts to safeguard the peatlands.
Almost more than 10000 hectares of peatland get destroyed for oil palm and agricultural plantations. As residential construction takes over farmlands, they destroy peatlands to increase their expanse. The greenhouse gas emissions are on the rise with each year’s reduction.
In India, peatlands are found in Kerala, Arunachal Pradesh, north Sikkim, Himachal Pradesh, and some parts of the Western Ghats. Deltas and mangroves abound around us.
Indonesia has the largest peatland area, spread across 13.43 million hectares. Sumatra, Kalimantan, and Papua. Russia, Canada, the United States, and Indonesia have the most peatlands in the world.
Sustainability initiatives need to be strong in countries where peatlands form a large part of the problem.
2. Increase in fresh water pollution across the globe & sustainability initiatives
We will also look into the conditions of different rivers in this article.
How much time and money can go into cleaning these rivers, if not the geysers, springs, lakes, and ponds?
Do you know the most polluted rivers in the world and where we might have to focus our sustainability initiatives to make the world a better place to live?
Here is a list that you can’t miss if someone is planning to understand where to start with their sustainability initiatives for changing the water we still have.
| Ganges (India) | Marilao (Philippines) |
| Citarum (Jakarta) | Matanza (Argentina) |
| Pasig (Manila) | Jordan (Israel & Jordan) |
| Buriganga (Dhaka) | Holston (E Tennessee) |
| Sarno (Pompeii) | Yellow River (China) |
| Yangtze (China) | Yamuna (India) |
| Cuyahoga (Cleveland) | Indus (trans-Himalayan) |
| Mississippi (Mississippi) | Wadi Faynan (Jordan) |
| Nile (Egypt) | Amazon (Amazon Basin) |
Each of these carries a different source of pollution. It is interesting to learn what makes these strong rivers polluted, and sustainability initiatives would mean a separate plan for every river?
| Ganges | Sustainability initiatives should focus on clearing untreated sewage, agricultural waste, burnt bodies |
| Citarum | Toxic wastes, textile wastes, garbage, wastewater, livestock and fishery waste |
| Pasig | Garbage, untreated household wastes, and industrial sewage |
| Buriganga | Garment, dyeing plant waste, sludge |
| Sarno (Pompeii) | Industrial and agriculture waste |
| Yangtze (China) | Sustainability initiatives should focus on clearing liquid wastes from industries, agricultural, fish & pig farming, and dams |
| Cuyahoga (Cleveland) | Storm drains, sewage, toxin, fertilizer |
| Mississippi (Mississippi) | Sustainability initiatives should focus on clearing mercury, bacteria, PCB (polychlorinated biphenyl), nutrients. |
| Nile (Egypt) | Sustainability initiatives should focus on clearing nickel, cadmium, chromium, lead, copper, and zinc, apart from agricultural wastes, oil, & wastewater |
| Marilao (Philippines) | Fur, textiles, municipal waste bins, untreated hexavalent chromium, and tannery waste |
| Matanza (Argentina) | Sustainability initiatives should focus on clearing effluents from 15000 industries |
| Jordan (Israel & Jordan) | Sewage, fertilizers, pesticides, hormone-rich effluents from the fishing farms. |
| Holston (E Tennessee) | Sustainability initiatives should focus on clearing RDX (Royal Demolition eXplosive- 1,3,5-trinitro-1,3,5-triazine) from Holston Army Ammunition Plant reaches its waters and supplies it to 56000 Tennessee and Virginia residents. |
| Yellow River (China) | Sewage, agricultural and farmland waste, and environmental plastic waste. |
| Yamuna (India) | Sustainability initiatives should focus on clearing domestic sewage, industrial effluents and agricultural effluents |
| Indus (trans-Himalayan) | Agricultural wastes, sodium nitrates, phosphates, and pesticides. |
| Wadi Faynan (Jordan) | Heating blue-green copper ore and charcoal over fire during the Copper Age |
| Amazon (Amazon basin) | Sustainability initiatives should focus on clearing mercury, artisanal, and small-scale gold mining |
If you carefully go through the waste sources, no two rivers are the same even in their nature. Different cleaning techniques need to be available for different kind of pollutant present in different rivers. But that would surely mean spending an exorbitant sum of money, and governments will need to put special funds in place.
Ganges was getting cleaned as part of the Clean Ganga project, a part of several sustainability initiatives for the current Ganga, but there will always be a need for regular maintenance of the level of cleanliness the government tried to achieve with this project.
3. Increase in industrial development
In 1981, as per data analysis, almost one-third of the world population lived below poverty, compared to 2001, when it stood at 18%. Keeping in mind that there was a huge increase in the world’s population from 1981 to 2001, the decrease in poverty margins among people is a significant achievement. Sustainability initiatives would mean striking a balance between industrial development and the environment.
Post-World War II, a few countries did very well in decreasing the poverty margin in their populations. Few among them were China, Korea, India, Taiwan, Indonesia, Mexico, and Brazil.
The driving force behind this rapid development of these countries, especially China and India (two countries with the world’s largest population), could only be possible due to the rapid industrial development of these two nations. Even South Korea’s growth heavily relies on their ability to develop their industries quickly.
India grew due to its industrialization policies and dominance of the state in economic matters. But every country that rapidly grew from developing to developed and developed to augmented developed nations benefitted the most from their industrial revolution attempts, including the United States and the United Kingdom.
What led to such enormous growth also led to the decline of our environment. The world seems like a two-way sword at times. If you want to abolish something, you will, in return, create something equally harmful and deleterious. Both sides of the sword indicate nothing but death, and man is in constant struggle with these sides. To keep one side, they are always losing the other side, and sustainability initiatives would mean striking a balance.
Industrial effluents, harmful chemicals, plastics, and poisonous sludge or metal fluids get released into large rivers, causing massive pollution of the environment. Industrialization and the environment should balance and support each other. The countries with the most favorable and least favorable environments heavily depend on industrialization. Below are the names of countries that might help you understand which countries have grown minimally in the industrial segment and still have a favorable environment.

| Country | EPI (Environmental Performance Index) |
| Denmark | 77.9 |
| United Kingdom | 77.7 |
| Finland | 76.5 |
| Malta | 75.2 |
| Sweden | 72.7 |
| Luxembourg | 72.3 |
| Slovenia | 67.3 |
| Austria | 66.5 |
| Switzerland | 65.9 |
| Iceland | 62.9 |
| India | 18.9 |
| Myanmar | 19.4 |
| Vietnam | 20.1 |
| Bangladesh | 23.1 |
| Pakistan | 24.6 |
| Papua New Guinea | 24.8 |
| Liberia | 24.9 |
| Haiti | 26.1 |
| Turkey | 26.3 |
| Sudan | 27.6 |
These high EPI countries have undergone the least environmental damage, have managed their industrial revolution better, or have been conservative about it. Their water bodies are also, thus, in better condition than other countries down the list. Even those not mentioned in the list are not doing very well with their water pollution levels. Hence, decreasing the drainage of industrial effluents into rivers needs to be stopped to regain the health of this planet.
The Environmental Performance Index is an indirect way of measuring how polluted the water is. There are obviously direct measuring methods, and yet, EPI can help come to a conclusion immediately.
4. Food Production & Sustainability Initiatives
Fertilizers help in the production of crops, and food production often relies heavily on fertilizers to meet its demands. The rise in population, less arable land space, and increased market pressure are some of the key factors contributing to the increased use of fertilizers.
According to the fertilizer market forecast, the market will reach $202.89 million by 2026. A CAGR of 4.5% is being predicted for the years 2021–2026.
According to Statista’s report, the fertilizer market is growing for fertilizers like nitrogen, phosphorus pentoxide, and potassium oxide.
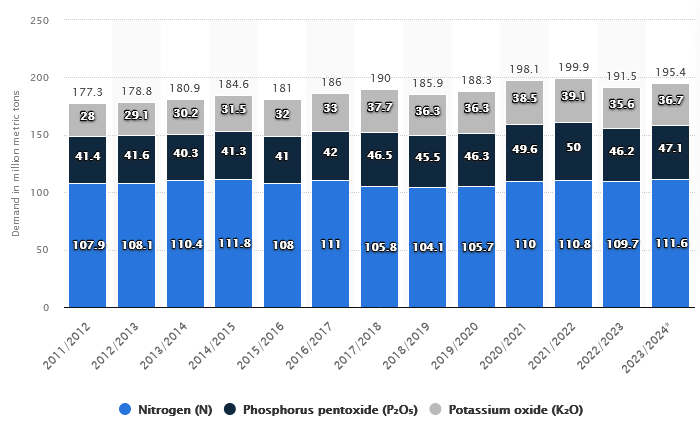
Despite efforts being put in place to minimize the impact of fertilizers and decrease their demands, their increased use is a cause for concern for the environment.
Coating urea with neem oil is being largely used in India as part of the nano urea project. Benefits include lesser use of urea, and even bag sizes have been reduced from 50 kg to 45 kg. Liquid nanourea (LNU) is a necessity, as it is the best way to supply nitrogen to crops. But despite every effort, it is still a challenge difficult to overcome.
Excessive use of fertilizers causes the leaching of nutrients like nitrogen and phosphorus into water bodies. This kind of activity will lead to an algal bloom, eutrophication, and other environmental problems.
5. Improved sanitation
Improved sanitation is a necessity in today’s world, but sanitation is causing a lot of underground water pollution. The seepage of sewage into underground water channels is increasing due to increased underground sewage flow.
Construction sites do not maintain the basic standards and rules of sanitary hygiene. The distance between two sewage pits is not being maintained due to excessive cramming of buildings in certain areas. The building of sewage pits is often not done properly, and cracks in these sanitation pits also lead to seepage of sewage into neighboring areas.
Defective pipes, joints, and manholes contaminate the surrounding area. Different parameters guide the seepage of water to surrounding areas, like the length of the collection pipe network, diameter of pipelines, drainage areas, soil types, water table depths, topography, and number of connections per unit area.
Sustainability initiatives in terms of improved sanitation would mean either creating more and more self-sustainable villages using their own sewage for producing bio gas that can serve their needs well. In this way, keeping the atmosphere clean is easily feasible.
6. Planned gardening efforts
Planned gardening is the new way to beautify our surroundings. In terms of planned gardening, Australia tops the list, closely followed by China, Mexico, the US, and Germany. South Korea also has a lot of planned gardens, along with Japan, Spain, Russia, and Argentina.
Planned gardening ensures the loss of plants and trees is minimized, but on the other hand, it can be a polluting factor for the soil and nearby water bodies. The natural environment is lost, and what takes over is an artificial environment where man guides the show. Small water bodies face leaching issues, and most lakes are examples of such damage.
Some lakes are surrounded by artificial gardens to attract tourists. However, it consistently serves as a source of damage to the water body.
However, there is already a better version of these gardens called the rain gardens, where the rain water supposedly serves as a way to rehydrate the nearby aquifers.
Keeping a check on planned gardening can prevent the increased use of fertilizers and excessive use of freshwater for maintaining these gardens in regions where there are no recycled water plants.
7. Increased construction activities
Construction activities have increased manifold. Huge amounts of water go into creating the concrete forests, and a lot of water is pulled out of the available surrounding water bodies. Drying up the neighboring borewells or wells happens when there is a sudden increase in the extraction of water at a particular point in an area. The fact that the water table dips in these areas becomes a source of concern for many.
With China standing atop having 1175 infrastructures coming up in 2022, others follow closely.
An estimated 350 to 400 liters of water are spent constructing a one-square-foot wall. It incorporates several activities in the process.
- Residing people on the site
- Brick laying
- Cleaning equipment
- Making mortar
- Wetting the bricks
Watering the walls to promote proper adhering of the cement to the brick and sand
8. Increased hospital and educational facilities
Hospital waste and more and more educational facilities are undoubtedly helping the growth of the world. But they are adding sewage and other kinds of waste that are concentrating more in a place and seeping underground.
A single place could be impacting the surroundings harshly. The use of larger amounts of groundwater is also quite prevalent in these organizations and institutions. Thus, it is but usual that the water table of these places goes down, harming the normal surrounding requirements.
9. Sustainability initiatives impaired by misuse of water
If underground water could be used only for drinking and recycled water could be available in every country and region, it could still solve our problem. But constructing these huge mechanisms for recycling water is a fund-depleting initiative. As part of sustainability initiatives, not misusing water is thus the most rational step forward.
Dripping water from tankers, open taps, broken taps, and no-lock taps serves to spill water more and more. Additionally, broken pipelines and dripping storage facilities could save tons of water that could be reutilized for better.
10. Encroachment of fresh water resources by certain profit motive agencies
Sustainability initiatives cannot succeed as long as there are people who hoard the water and sell it for higher prices.
In a recent report from last year with the Food and Water Watch, it was claimed that many big banks and companies are buying water from rural places and suburbs. Companies are buying farms that have attached water claims. During droughts, this hoarded water would be sold at prices of gold or higher, according to many.
But waiting for drought and hoarding what could be utilized by people is adding to the climate crisis. It is also becoming a significant concern for those who need water right now and surely serves as a roadblock for those working towards granting and ensuring sustainability initiatives.
Wealthy rich people are drilling deeper than the municipalities to acquire the water drying out wells and nearby water facilities.
Australia, Chile, the United States, Iran, and even the United Kingdom are some of the most prominent water trading markets worldwide.
Conclusion
Sustainability initiatives of the olden days would need to be revived within a short period of time. These measures must be implemented at a national level, with penalties for regions not abiding by the water laws. This could perhaps save the country from facing the wrath of these sixty thousand clans of fish who got sacrificed for the welfare of humanity and still recycle back to us, bringing food to us, or even Kapil Muni’s and King Bhagirath’s contribution towards creating a better land in India (earlier known as Bharat).

You must be logged in to post a comment.